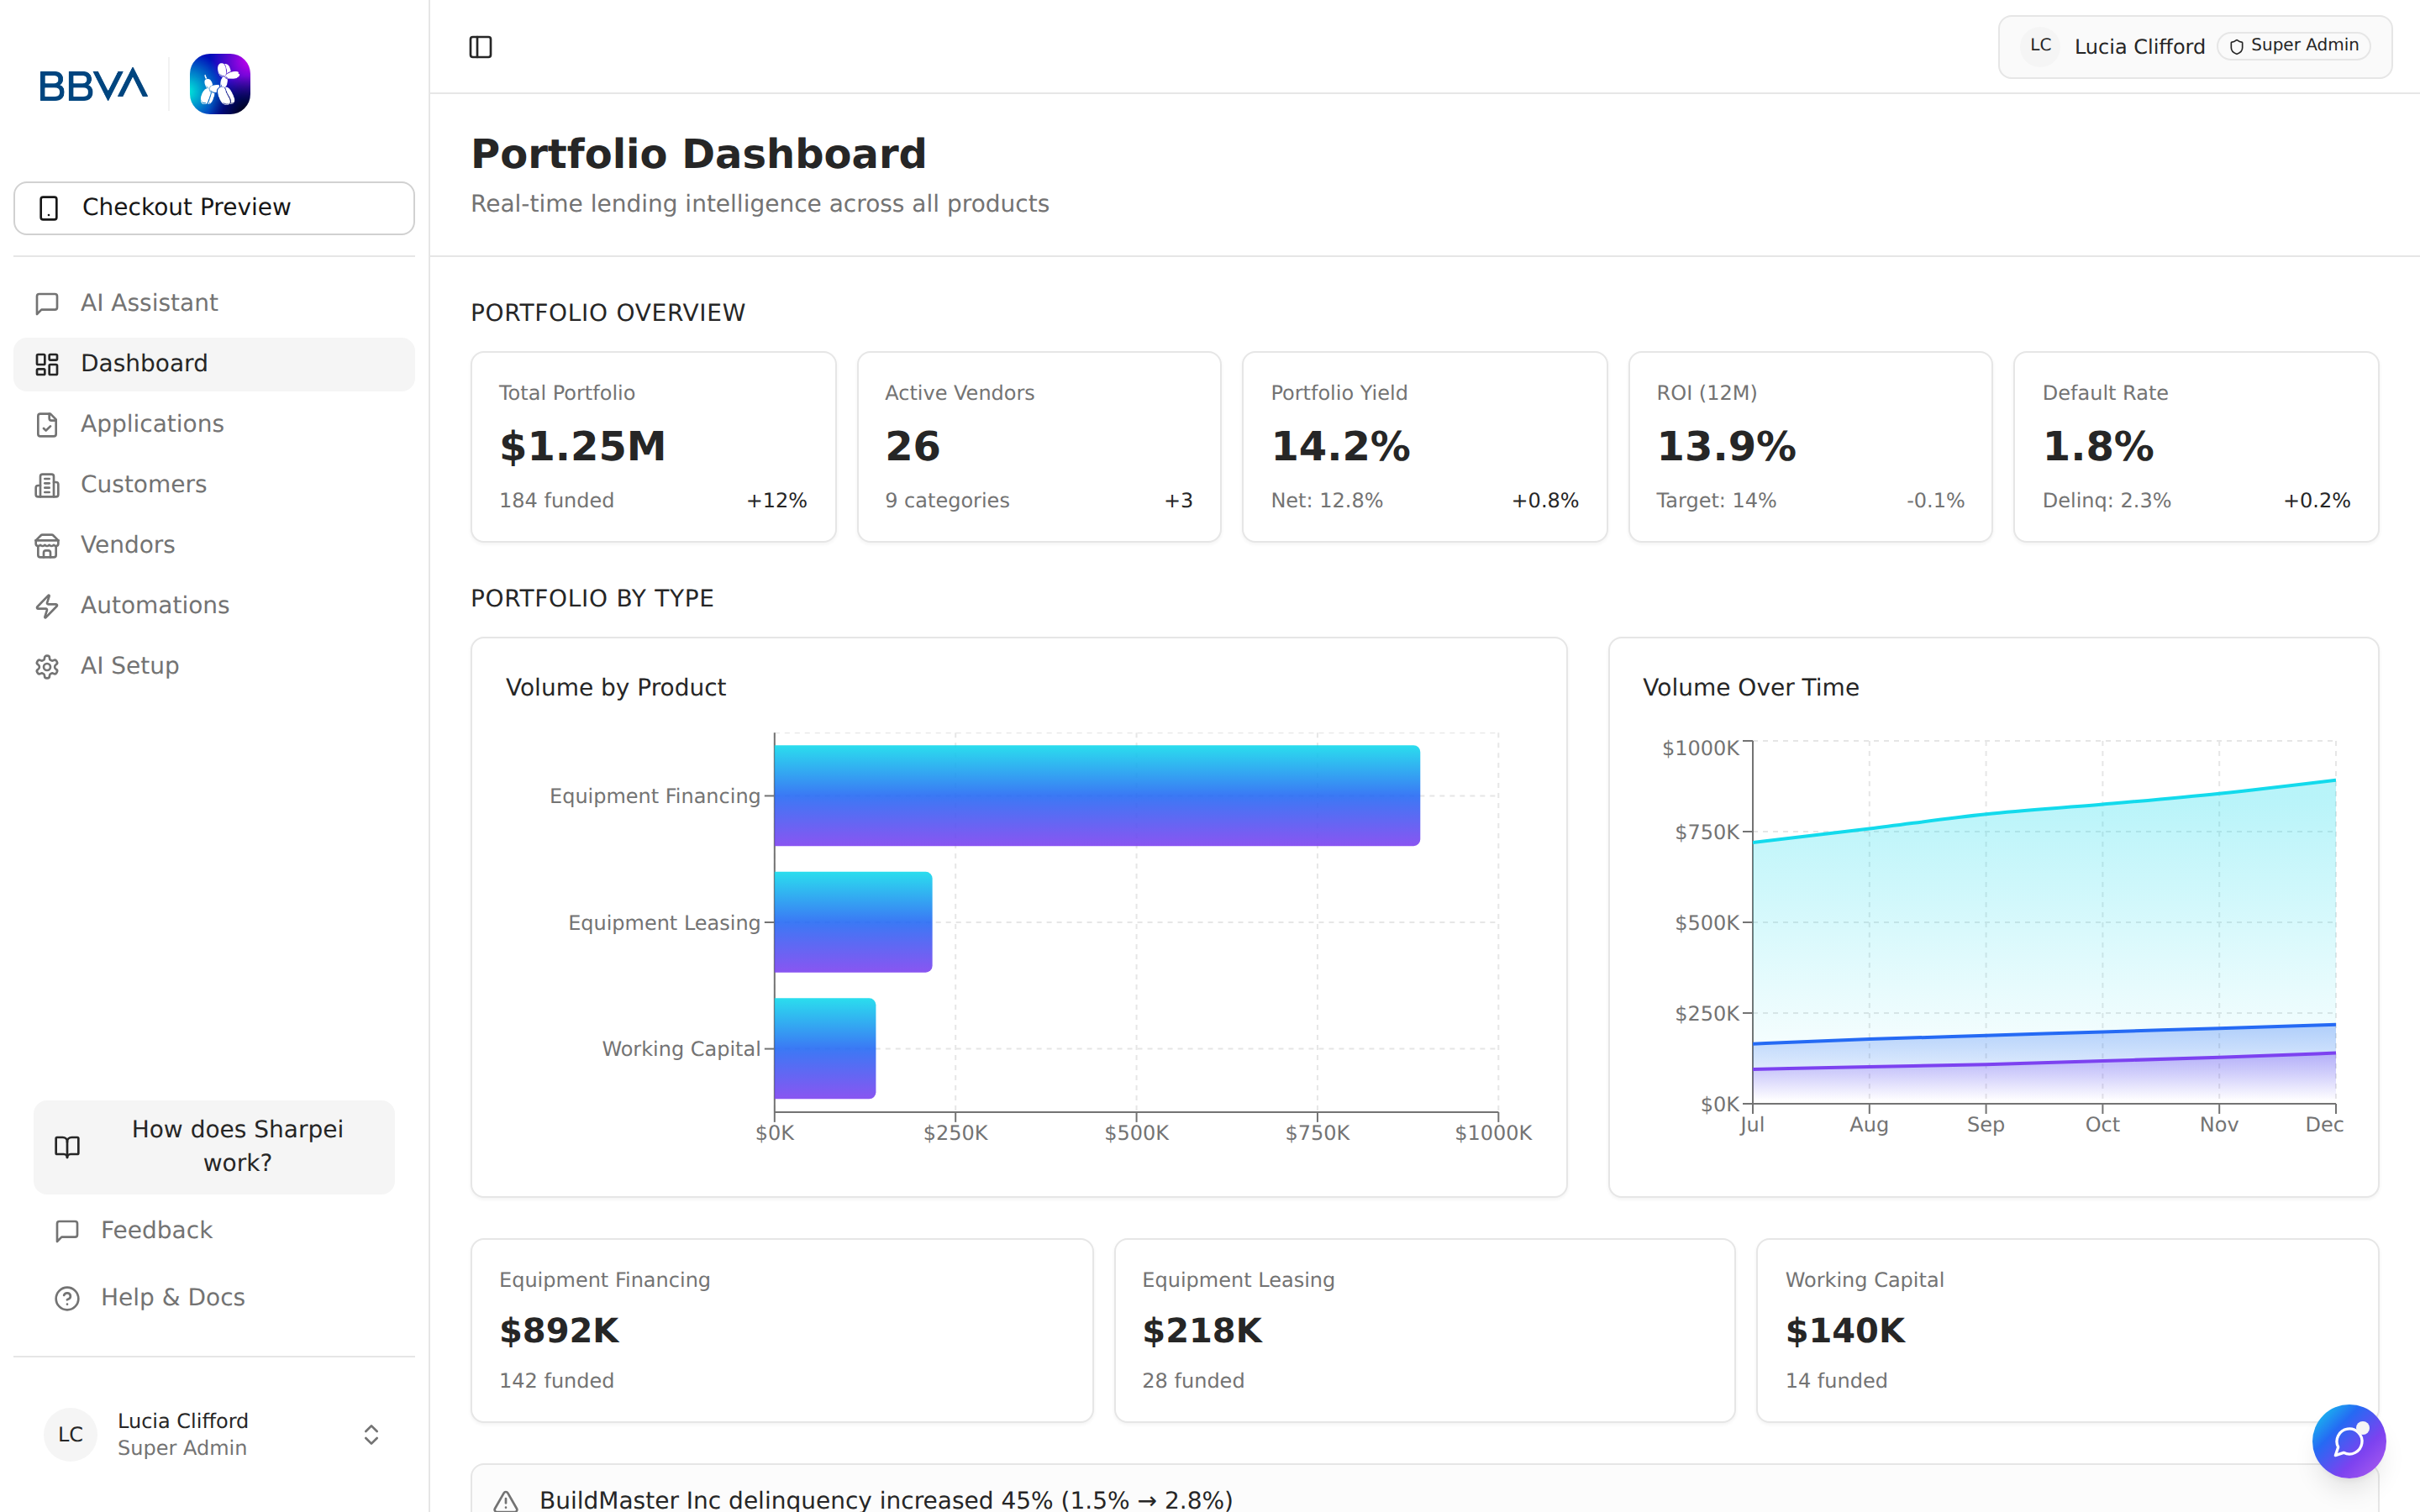
The Dashboard gives your team a real-time view of your intake pipeline — how many applications are coming in, where they are in the flow, and which vendors and customers are driving volume. It's not a portfolio or servicing dashboard; approval, funding, and delinquency data live in your LOS.
Dashboard KPI cards showing the intake pipeline at a glance
The top of the dashboard shows the four numbers that matter most for intake:
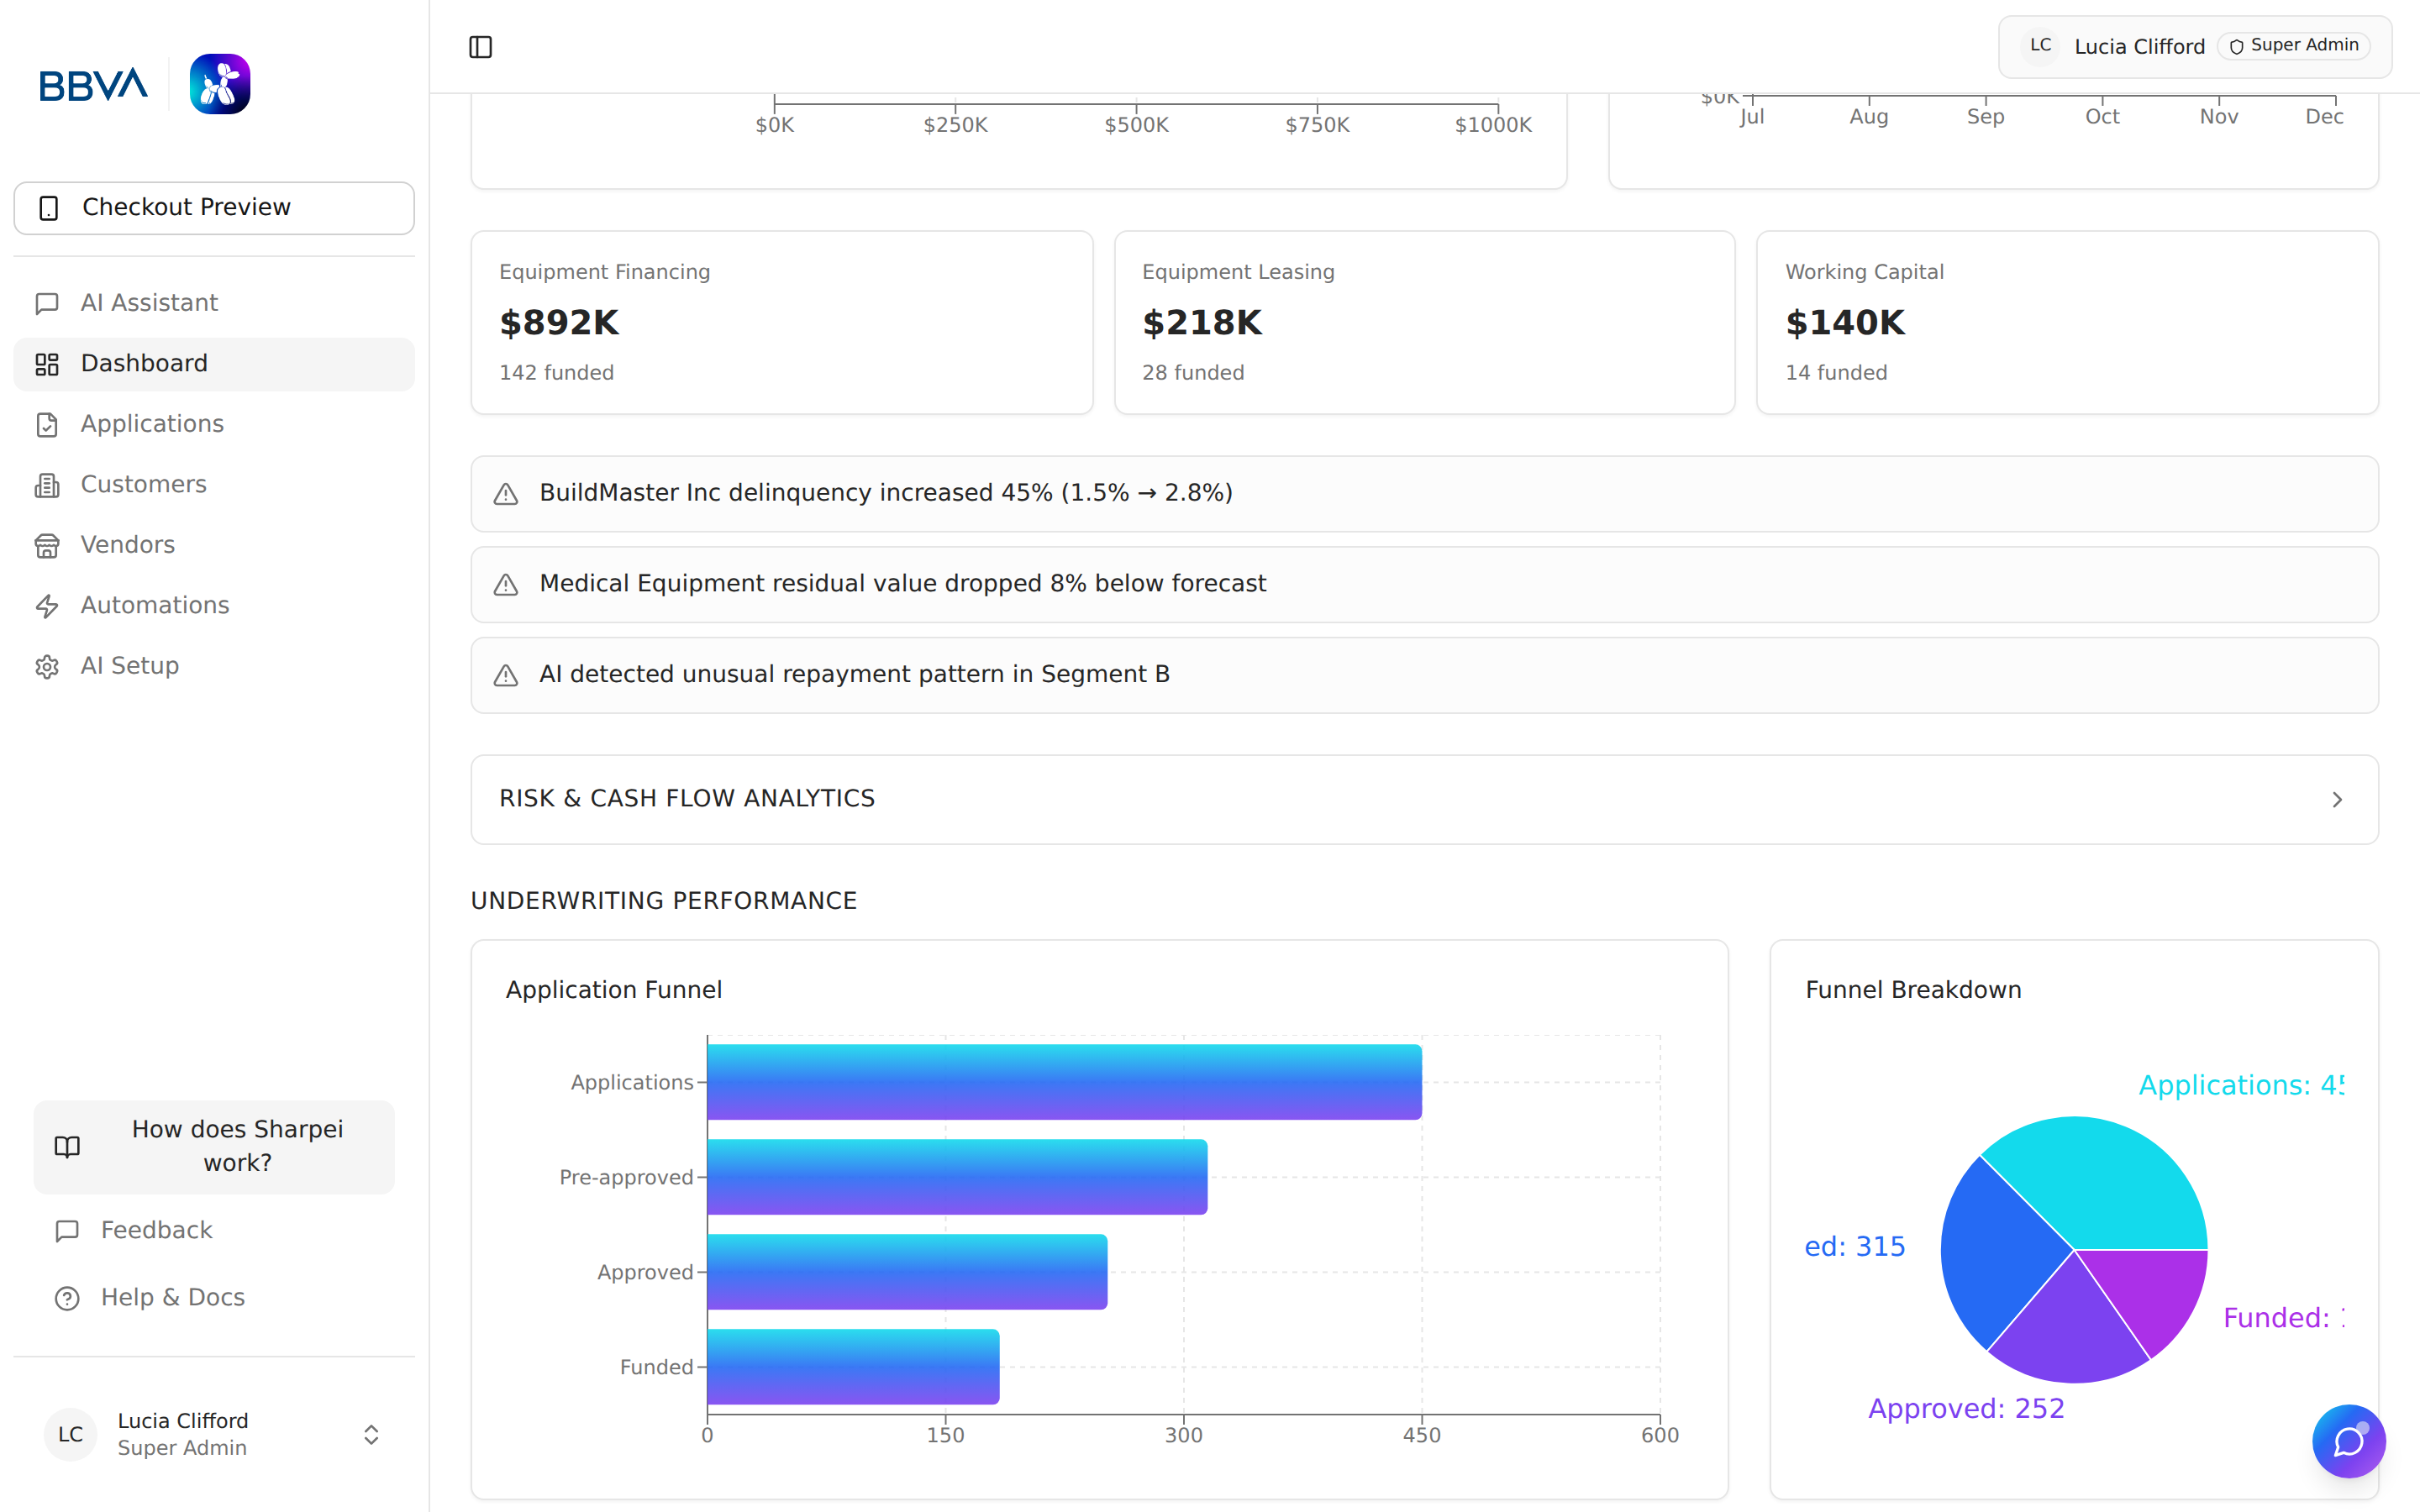
Application funnel showing conversion from intake through LOS hand-off
Track how applications move through each intake status so you can spot where deals are getting stuck:
The funnel shows how many deals sit at each stage and the drop-off between stages, so your team can focus chase effort where it moves the most volume.